CloudWatch is a powerful tool for optimizing the performance of AWS infrastructure. Businesses of all types have quickly come to rely on AWS CloudWatch metrics, whether in their DevOps group or from their managed services provider. However, along with CloudWatch's power comes a great deal of management complexity. Cutting through that complexity is the key to ensuring your organization is realizing all the benefits CloudWatch delivers.
What is CloudWatch?
The volume of performance data and other metrics generated by applications running on microservice architectures continues to skyrocket. DevOps engineers, app developers, and IT staff are challenged to track and report on the millions of events, metrics, and other operational data their systems generate. Amazon created CloudWatch to serve as a single pane of glass companies can use to monitor the performance of their applications and respond to problems quickly.
Breaking Through Data Silos to Create a Unified View
It isn’t unusual for an organization to have dozens of separate AWS resources, apps, and services running on remote AWS servers and on-premises. As a result, the company’s data can end up residing in departmental silos that are difficult to identify and monitor. The silos also affect a company’s ability to respond quickly to changes in performance and ensure optimal resource utilization.
To restore system-wide visibility, CloudWatch combines more than 70 AWS services, including Elastic Compute Cloud (EC2), DynamoDB, Simple Storage Service (S3), Elastic Container Service (ECS), Elastic Kubernetes Service (EKS), and Lambda, all of which are natively integrated. The service supports hybrid cloud architectures via CloudWatch Agent or API for monitoring resources that run on-premises.
Gain Operational Insights at a Glance
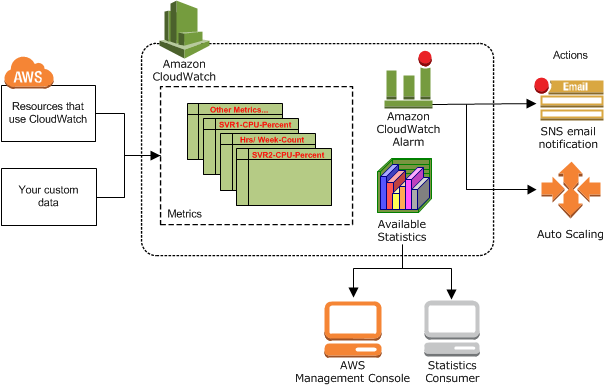
CloudWatch visualizes operational data collected from logs, metrics, and events in automated dashboards that deliver a unified view of all AWS resources, apps, and services. Troubleshooting is easier because CloudWatch lets you correlate logs and metrics side-by-side. The data is typically generated in 5-minute increments unless the customer opts in to 1-minute increments (known as enhanced monitoring) at an additional charge.
Alarms can be set to warn when metric values reach specific thresholds, or companies can use machine-learning algorithms to view and respond to unexpected conditions. Some responses can be automated when specific events occur, such as auto-scaling to address fluctuations in resource demand.
Why Use CloudWatch?
The last thing DevOps staff and other IT managers want is to be kept awake at night wondering whether their applications are up and running smoothly. That’s why CRN’s Gina Narcisi credits much of CloudWatch’s success to security and peace of mind. That peaceful, easy feeling extends to how managers respond when they receive an alert. It’s one thing to know that something went wrong. It’s quite another to understand why the problem occurred so a permanent solution can be put in place.
Faster Mean-time-to-resolution
CloudWatch’s ability to correlate logs and metrics helps firms move quickly from identifying a problem to understanding what caused it and finding a permanent fix. The same monitoring capabilities can be extended to .NET and SQL Server apps via CloudWatch Application Insights, which applies key AWS CloudWorks metrics across the technology stack:
- Databases
- IIS and application servers
- Operating systems
- Load balancers
- Queues
Additionally, CloudWatch integrates with many 3rd party monitoring tools seamlessly without having to add additional software in the mix to evaluate metrics.
Auto Scaling and Auto Response Via CloudWatch Events
Auto scaling is at the heart of cloud resource optimization. In CloudWatch, auto scaling can be triggered by setting a performance threshold at which an alarm automatically adds or deletes EC2 instances, for example, based on CPU usage measures. More precise control over automated actions is possible by using CloudWatch Events to create rules that trigger actions when specific application events occur, such as invoking a Lambda function or halting an instance.
Proactive Resource Planning
CloudWatch’s visualization and data analysis tools are able to spot trends and seasonal changes based on up to 15 months of metrics, which helps companies improve their resource planning. For example, CloudWatch Metric Math makes real-time analyses possible by allowing calculations to be applied across many different metrics at one time. The results can be analyzed in the AWS Management Console, displayed on dashboards, or retrieved via the GetMetricData API.
In addition, CloudWatch Log Insights makes it possible to write queries with aggregations, filters, and regressions instantly so operational problems can be investigated without having to spin up servers or configure other software. The Log Insights tool also lets companies visualize time series data, dive deep into specific log events, and send the results of queries directly to dashboards.
These are some of the other AWS services that can be used to complement CloudWatch:
- CloudTrail provides governance, compliance, auditing, and risk management for AWS accounts.
- X-Ray is used by developers to work on distributed applications, including those based on microservice architectures.
- AWS Config monitors and records resource configurations to allow current conditions to be compared with the customer’s optimal configuration.
- AWS Lambda functions can be triggered by CloudWatch events.
Partnering with an AWS Expert to Plan and Implement CloudWatch
Firms adopting AWS CloudWatch metrics soon run headlong into the complexity of managing such a powerful resource optimization tool. Amazon continues to introduce new features and extensions for AWS. For example, on Integration Developer News, Vance McCarthy describes the company’s announcements at the recent AWS Summit, one of which is CloudWatch Container Insights that automatically summarizes performance metrics for EKS in dashboards and lets users dig into data stored in Kubernetes clusters by pod, node, namespace, or service.
An alternative to battling CloudWatch’s management complexity head-on is to contract with an AWS managed services partner who uses CloudWatch and many other AWS services to optimize the performance of their clients’ complete AWS infrastructure. That is the approach the Dream Warrior Group chose when it combined its managed services with CloudWatch. The company, which offers digital web development and design services, converted from redundant server providers to relying entirely on managed service provider Mission, an AWS Premier Consulting Partner, for all of its cloud management needs.
The result was a tremendous improvement in Dream Warrior Group’s ROI and less worrying about service quality and uptime. The company also has more assurance that its cloud infrastructure will keep pace with the growth of the rest of its operations. Mission provides Dream Warrior Group with confidence in the strength of its AWS security, allowing it to focus its efforts on new product development.
As more companies come to rely on AWS CloudWatch metrics for the success of their cloud management, the consequences of mismanaging the AWS infrastructure create a serious risk to its operations. At the same time, the more features and functionality CloudWatch gains, the greater the potential benefits of the service for organizations of all types. The best way to minimize the risk and realize the many benefits CloudWatch makes possible is by tapping the knowledge and expertise of services such as Mission’s Managed Cloud.