Coping with the Complexity of Modern Applications: the AWS Perspective
The biggest challenge out there with modern applications is complexity. Over and over again, modern applications are typically created from a standpoint of meeting many different small pieces. These small different components, nowadays called microservices, were created because we needed applications that could rapidly change. And that’s great. But the downside to that is it creates tremendously complex applications.
That creates the kind of next challenge: How do you deal with these complex types of applications?
This is where the topic of DevOps comes into play. Too many organizations think DevOps is just about automating delivery. Automation is important. But it’s also important to know why you’re automating. The point is not to push a button and send code to production once a quarter. The point is to do this frequently.
It’s about how often and how quickly. Automation is a byproduct of your frequency of delivery — how often you’re innovating and trying things. It’s not automation first for its own sake. It’s automation in order to get this innovation flywheel in place. That’s the real point.
Let’s look at the development transformation at Amazon between 2001-2009 to gain some context around the evolution of microservices and, subsequently, the DevOps philosophy.
Development Transformation at Amazon: 2001 - 2009
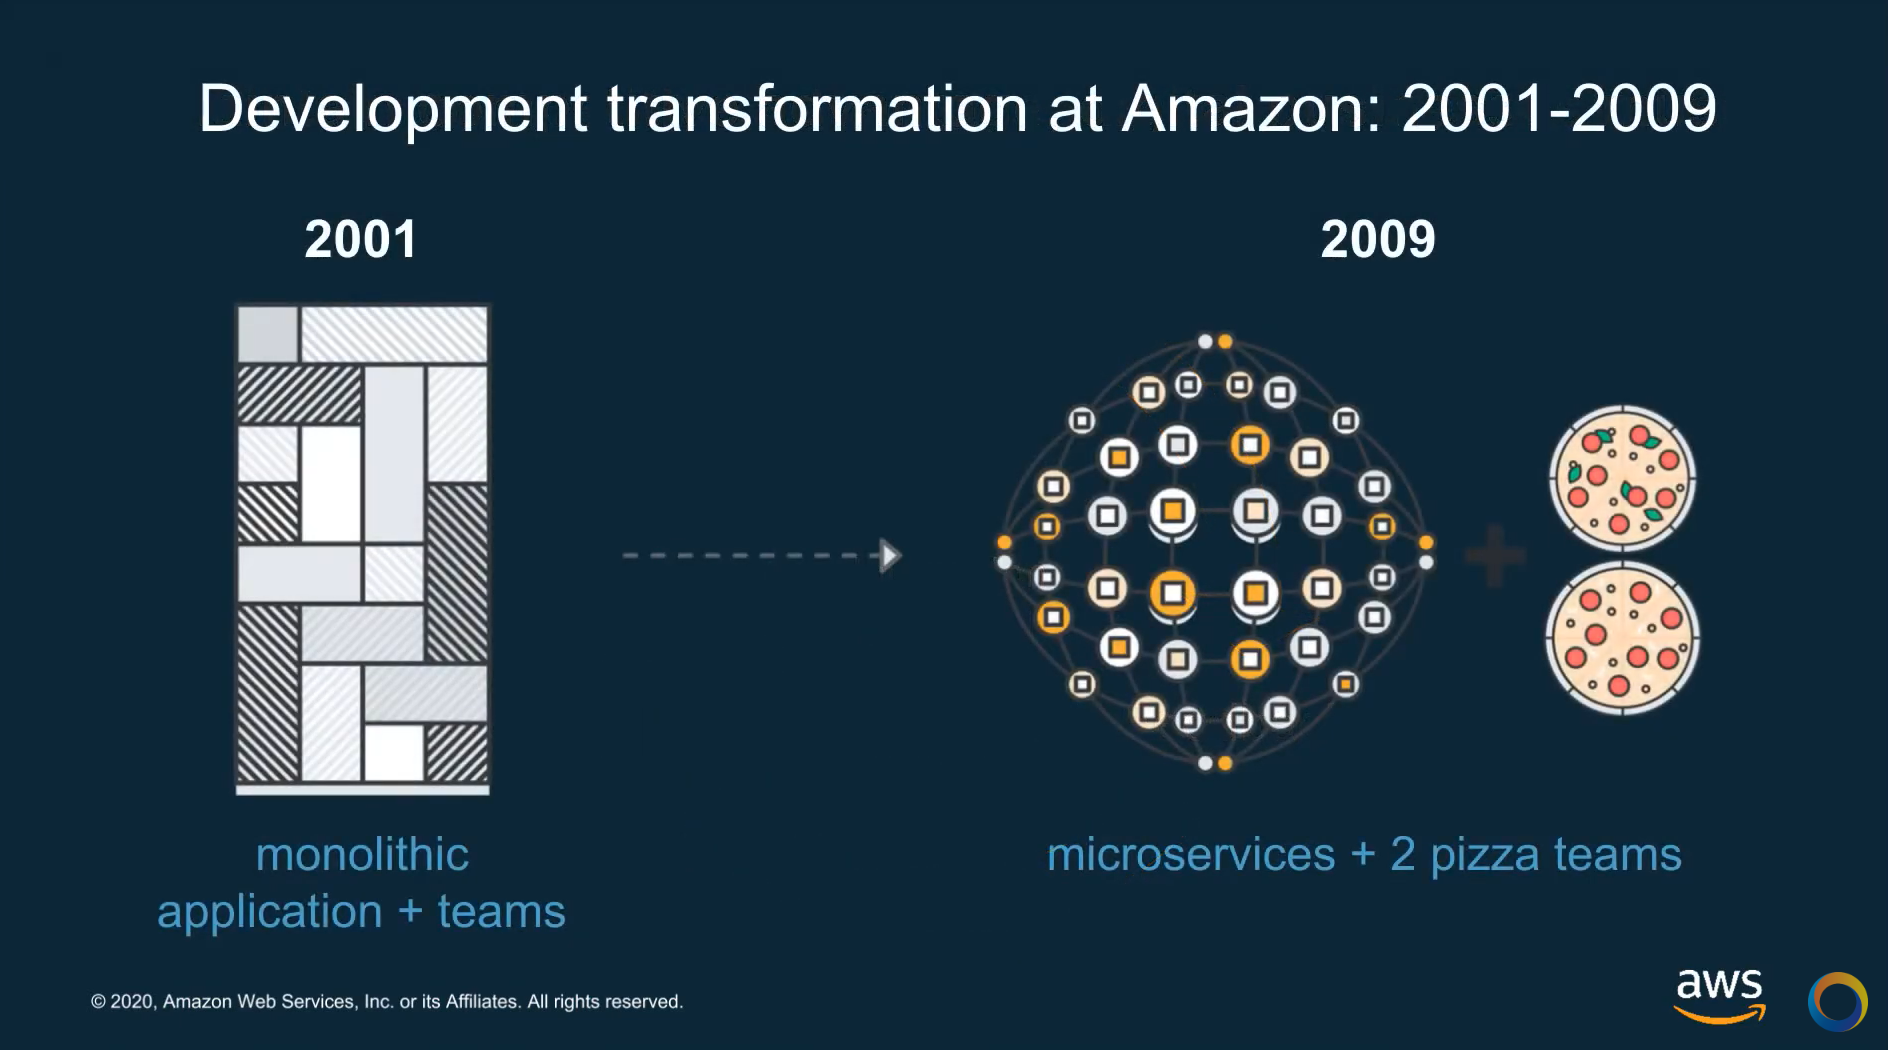
Like so many other organizations, AWS started out with a big model. They had a giant application: amazon.com.
In 2001, it had just one big relational database that everybody was sharing and using. A development team of several hundred people were all using this database. It became very cumbersome to make changes. They had to replace the whole thing one at a time.
To deal with this, they did something interesting and unusual for its time. They had a top-down directive to become bottom-up.
From the top down, they decided to incorporate what at the time was called service-oriented architecture. Nowadays, we would call this going to a microservices architecture. But back then, people didn't really talk about microservices very much.
They decided to start building all their software in terms of small components. Why small? Because independently of deciding to make everything separate, they decided they were going to work in small teams. This was where the well-known idea of two pizza teams came about — the idea to work in teams small enough that the whole team could be fed with only two pizzas.
This idea of small teams working independently on their own pieces of software became the goal within Amazon. They broke the whole organization from working on one big app made of a hundred pieces into what is now thousands of little companies working somewhat independently. What's interesting about that is that it’s scaled. But the flip side of this is that, as this evolved into thousands and (nowadays millions) of microservices, It got to the place where it was more than any one person could comprehend. This is where tooling became absolutely required.
Measuring Reliability Across Application Infrastructure with New Relic
Bringing everything into the one particular tool helps. It doesn't matter if it's logs or open telemetry, or if you’re using Prometheus or something else. What’s important is that you can aggregate it and work on slicing and dicing the data that you need.
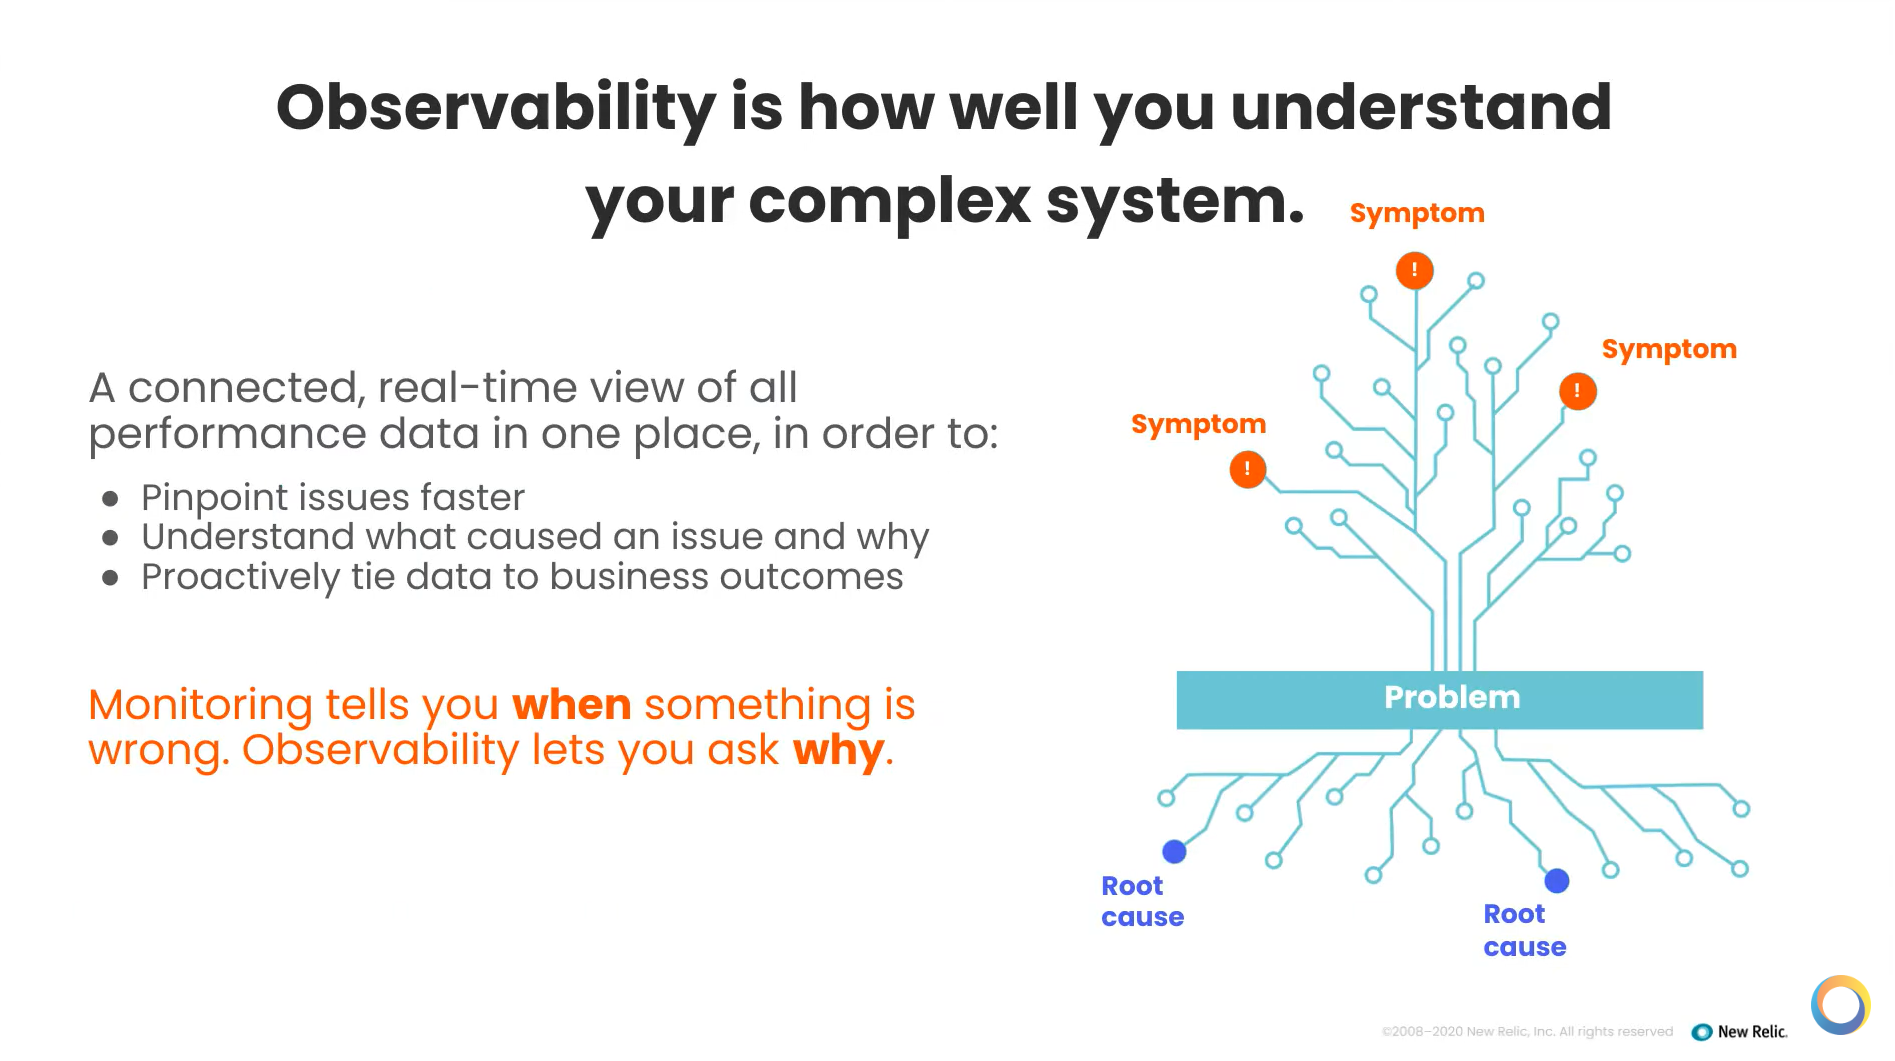
Observability is a term people are talking about a lot now — it’s a way that you can look at the system and not only know what happened, but why it happened and look at the root cause. Monitoring just tells you when something happens. Observability lets you ask why. And most importantly, why you would use that information. You want to be able to pinpoint issues and resolve them as quickly as possible. You also want to tie the data to business outcomes.
You can take advantage of that data in a lot of different ways. In terms of reactive strategies, you can gain visibility into your systems, establish baselines, setting basic alerts, and fixing the obvious problems. You can get rid of your outliers and understand “what's normal.”
From a proactive strategy, you want to be able to fix the issues before customers notice. You don't want to find out on Twitter that your site's down or people are having a bad experience. You also want to optimize the processes so teams can balance resiliency with speed. There's often a lot of pressure to deliver things more quickly. But if you're not able to roll back things really quickly, there are going to be some problems. So you want to be able to balance those two competing issues.
Finally, being data-driven, you want to be able to constantly improve the customer experience and make sure your systems are resilient.
So what does that look like inside New Relic?
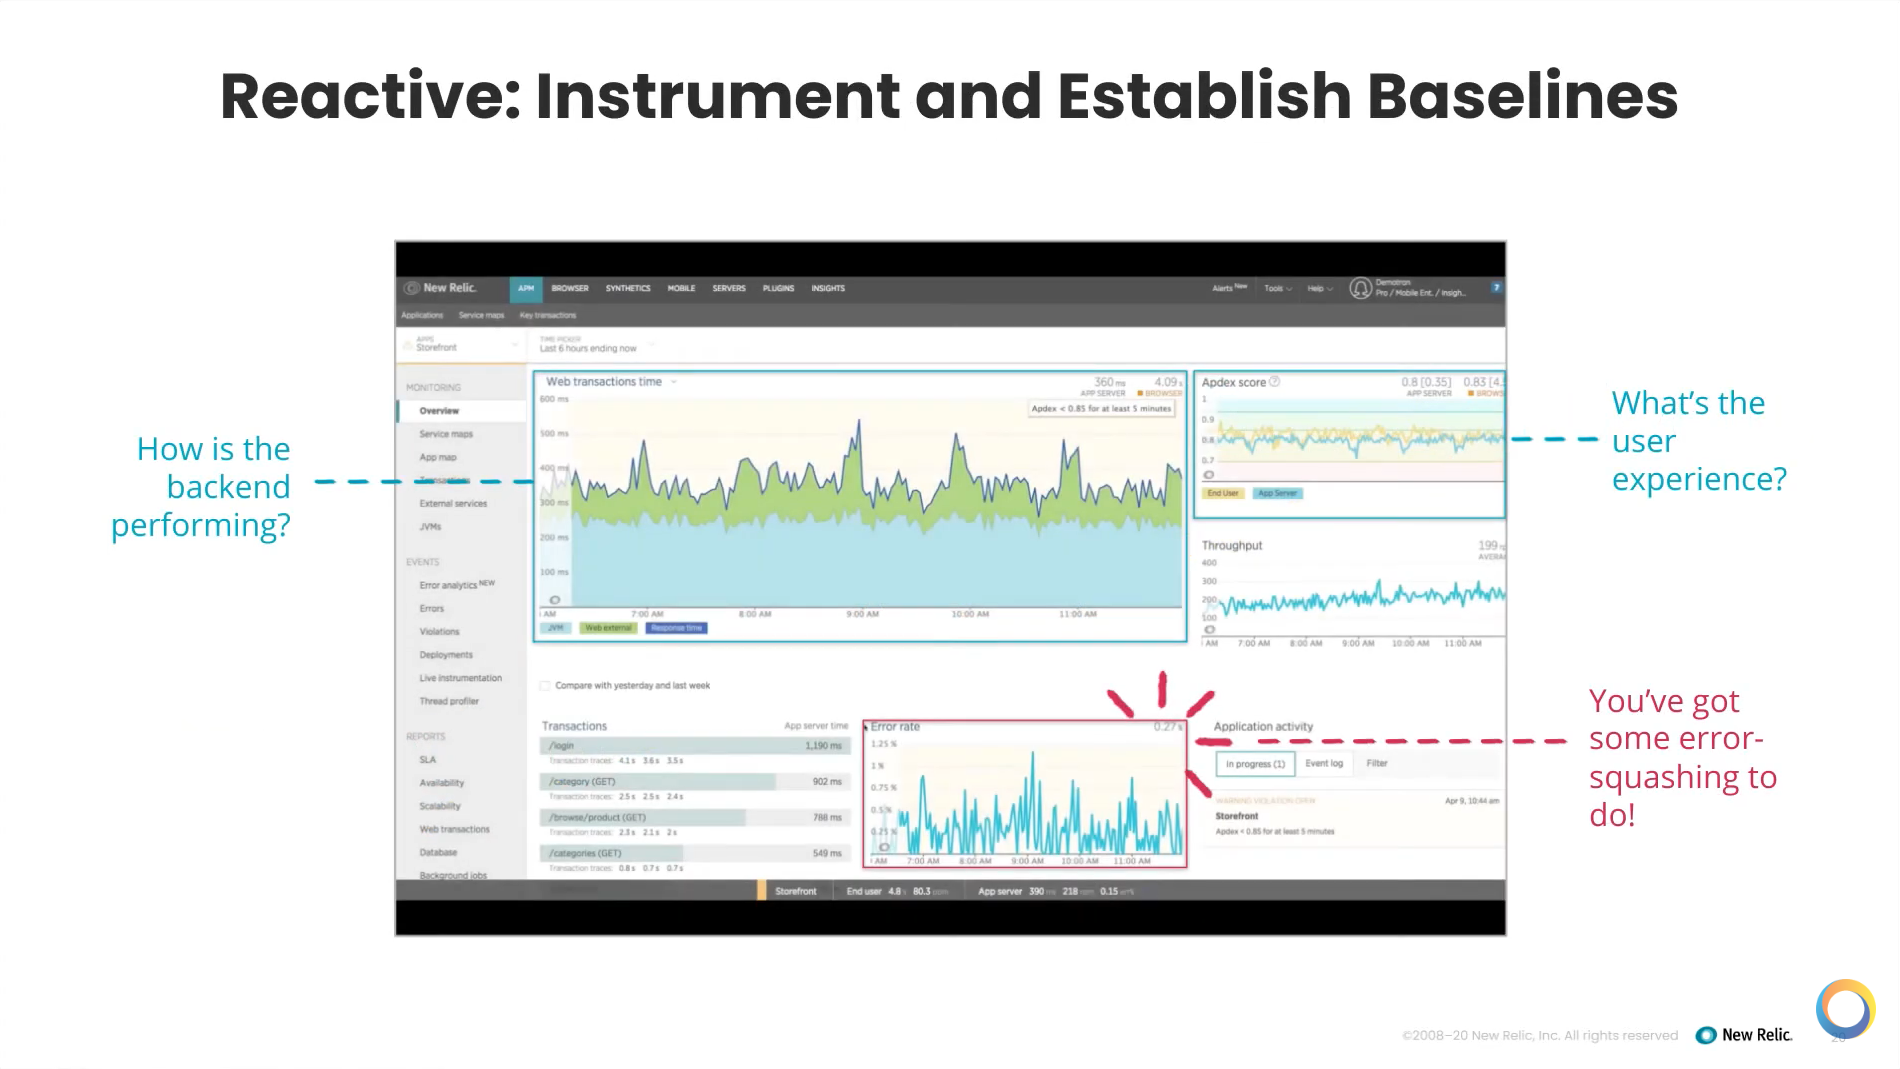
If you start out reactive, (this word has a bad connotation, but it's a good place to start), look and see how your applications are doing.
Also look at the user experience. New Relic has something called Apdex, which is a system comparison of numbers that give you a sense of how users are experiencing your system — whether they're happy, tolerating, or unhappy with it. It's a great place to start to get a sense of how your users are doing.
Next, look at your air rate. You've got to get rid of some of those errors because you want to smooth things out and get out the big outliers. Then you have a good sense of what normal is for the operations of your systems.
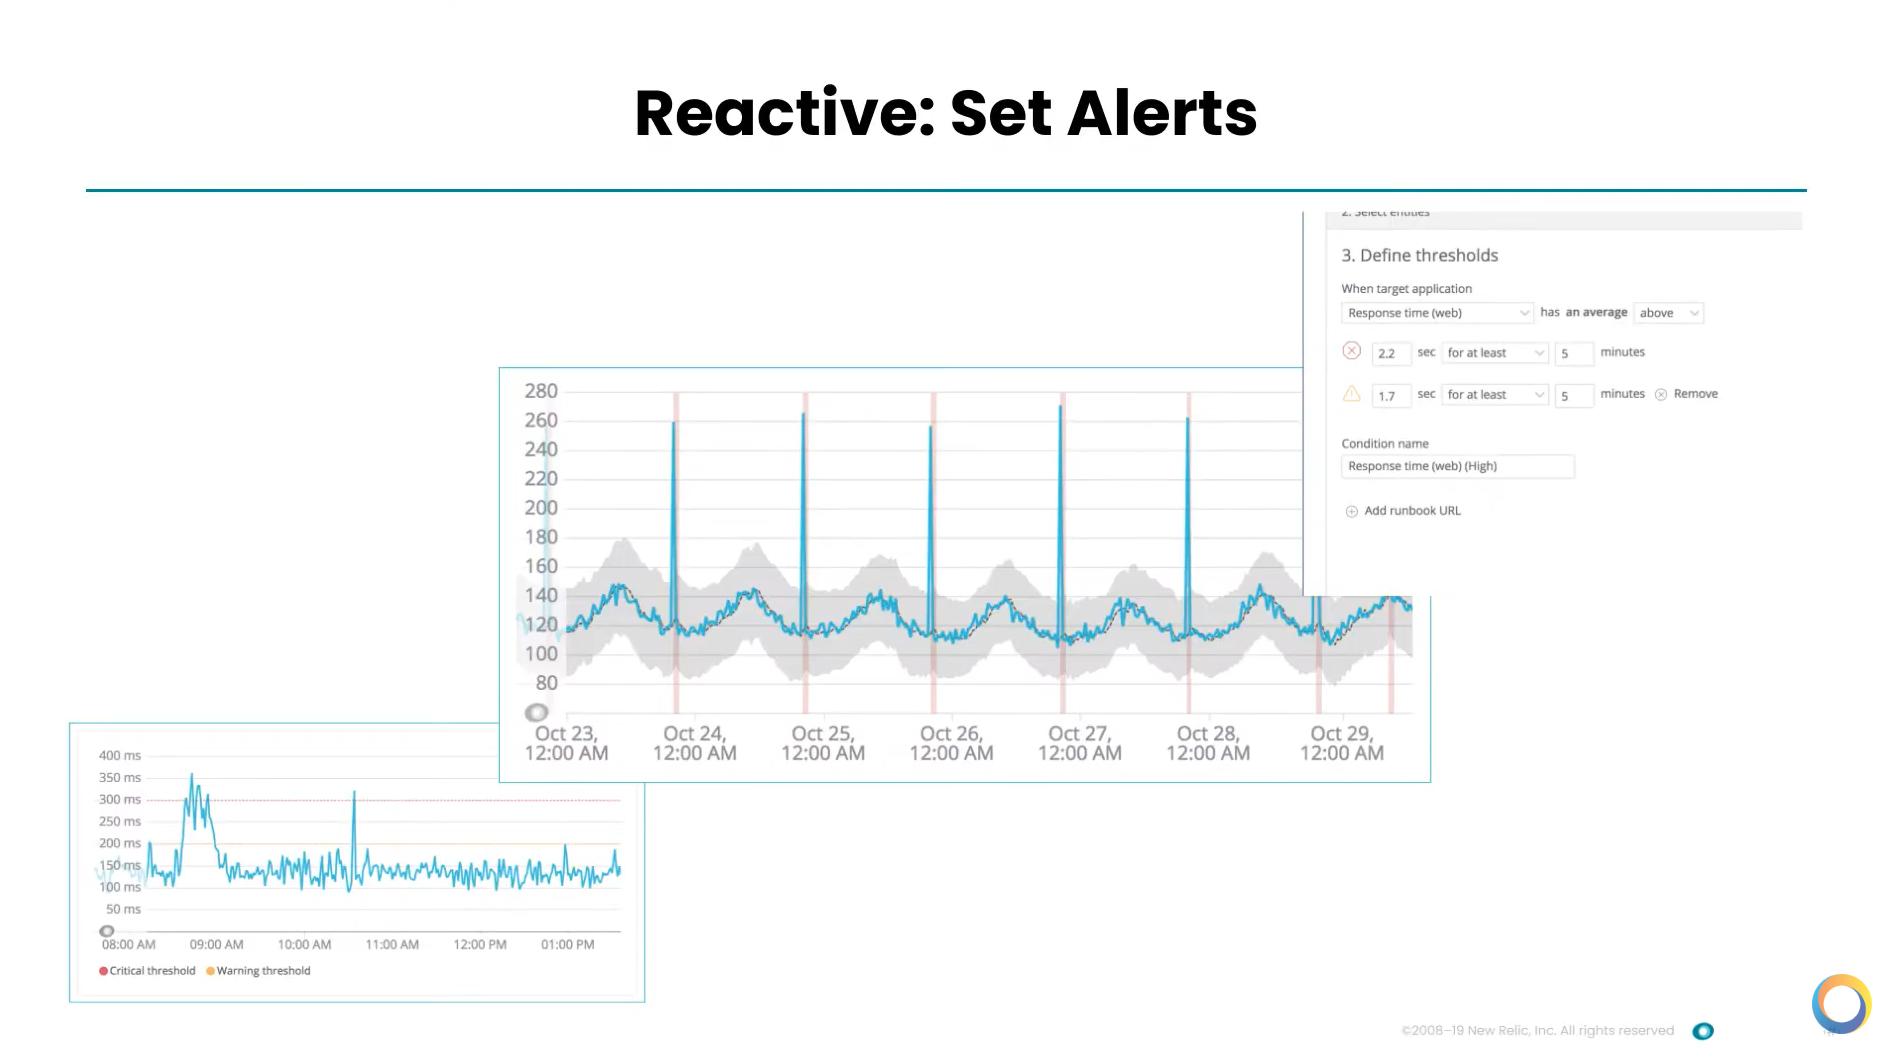
You also want to start setting alerts. Dashboards are great. There's a lot of things they can do. But obviously you don't have people that can sit around and watch dashboards all day. So it's important to set alerts, and it should be pretty darn easy to set them. And don't forget to tune them.
If you see the gray area in the above image, that's automatic baselining. New Relic can look at your systems and get a sense of what the band of normal is. And then it's very easy to define thresholds and answer, “How long do you want something to be flapping before you actually page somebody about it?” So it's important to set a baseline of alerts for that.
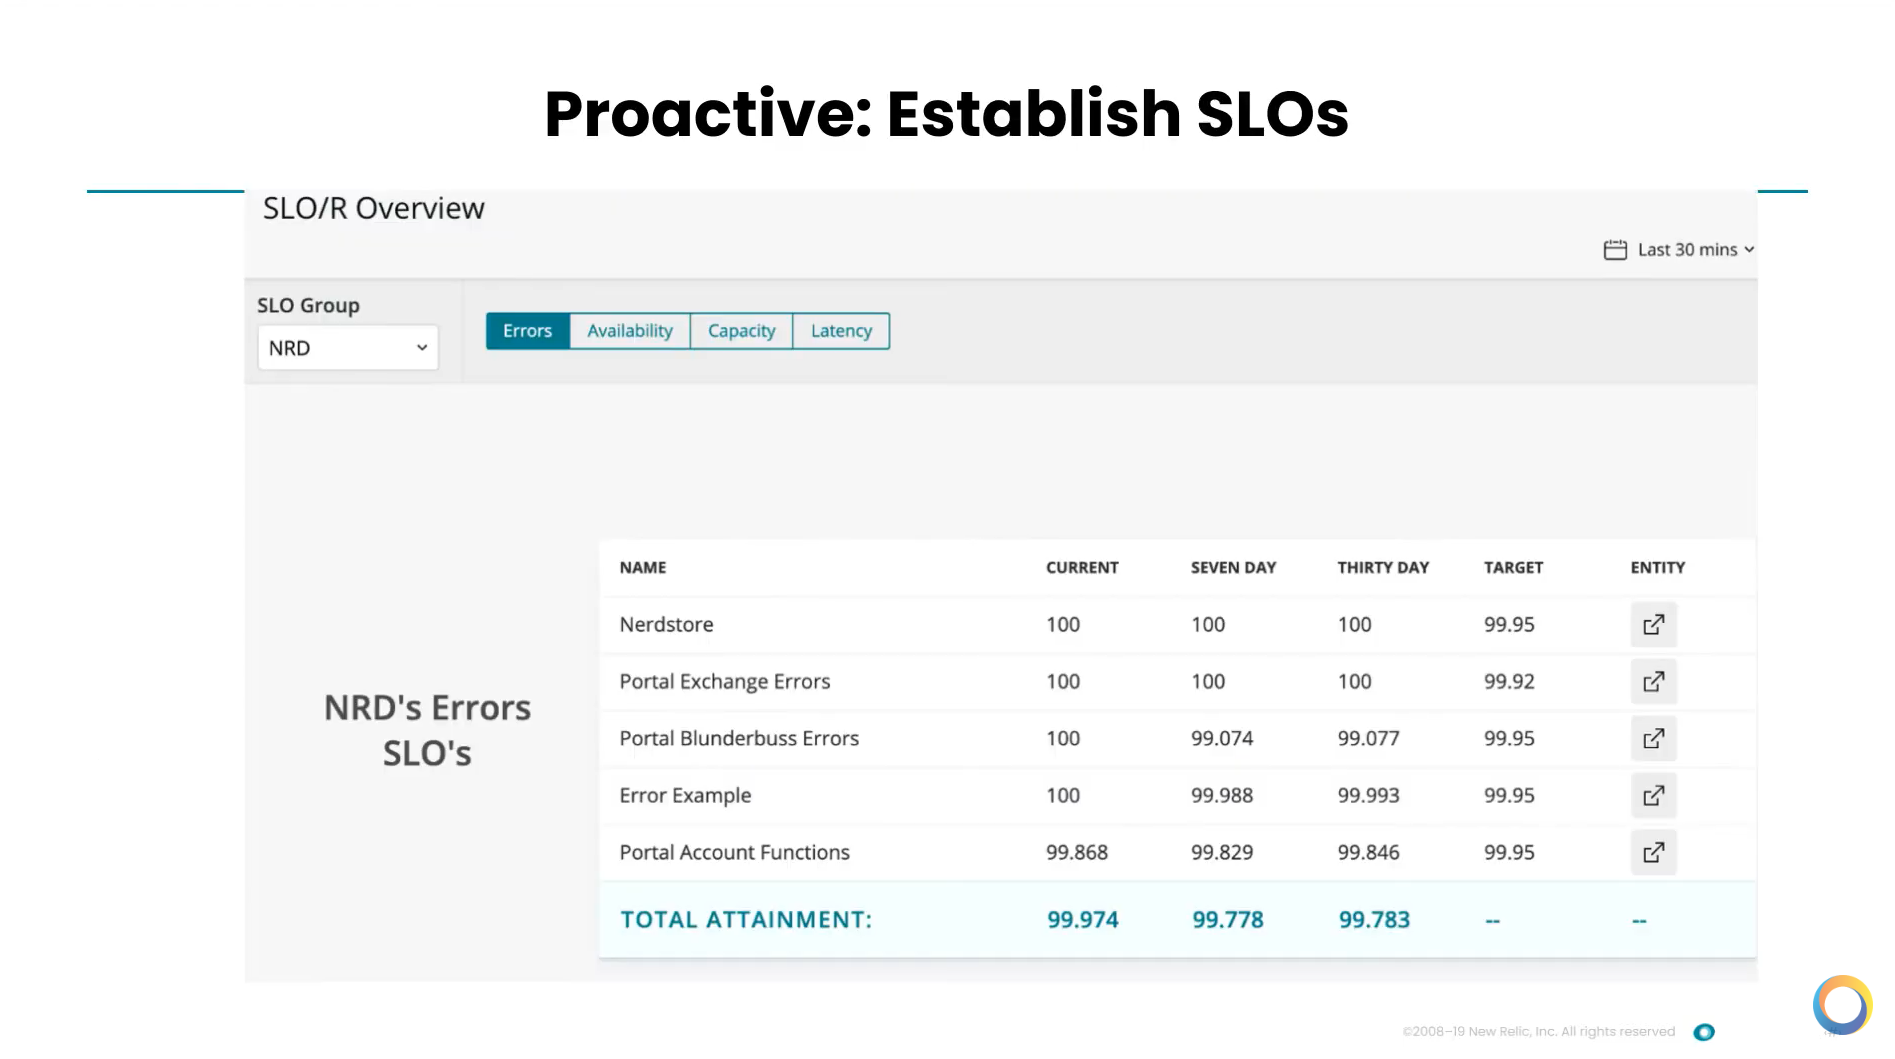
Moving into the next phase, it’s important it is to establish SLOs when being more proactive. The above case features users that wanted to scratch their own itch. So they went into the New Relic platform and built their own application, which is pretty straightforward and easy to do. Looking at the four golden signals, they want to understand how they’re doing with their targets. Then, if they need to, they can very easily go in and drill down to see what’s going on.
One of the biggest parts of setting SLOs is getting all the right people in the room to agree about what the most important thing is. This can be the hard work. Once it’s agreed upon, the tool is straightforward and easy to do. But it's really important to do that front-loaded work.
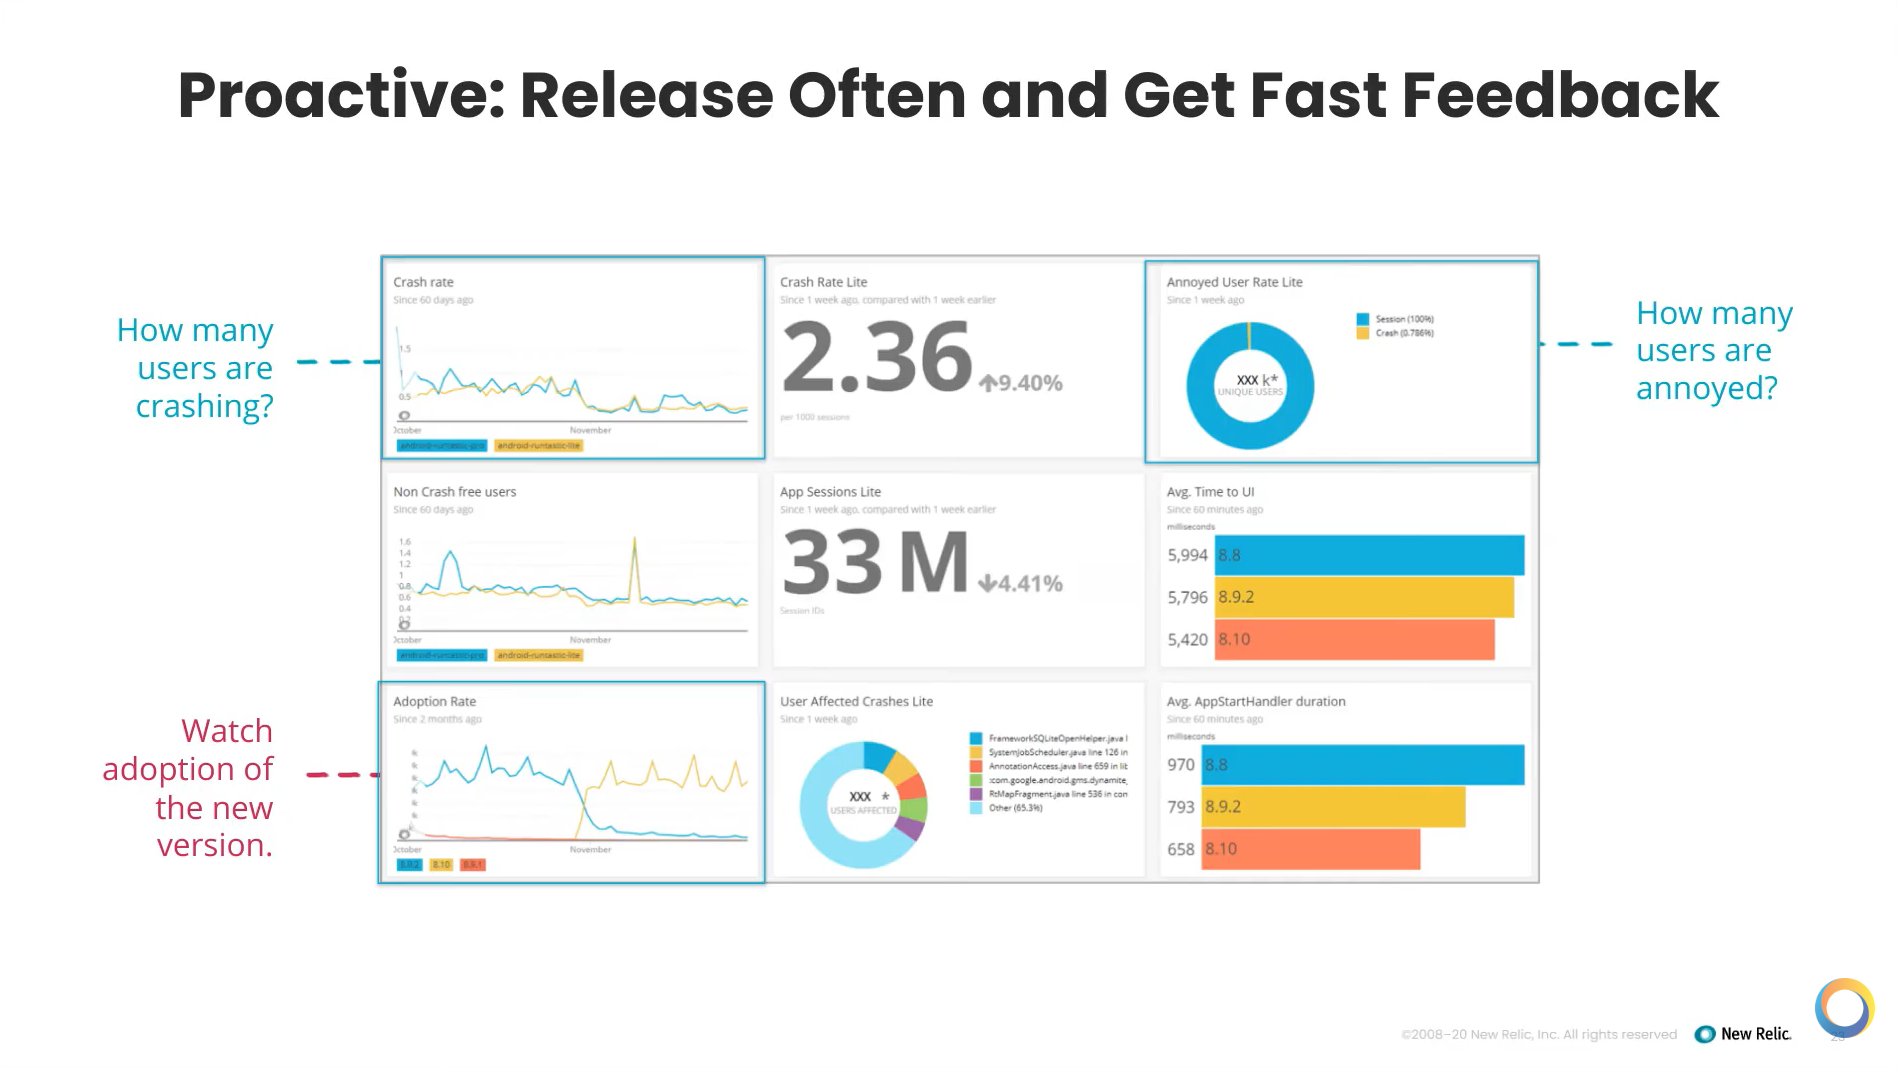
It’s also important to release often in the proactive stage and understand the impact of every release.
The above dashboard belongs to a New Relic user monitoring a mobile app they own. You can see that they want to know their crash rate — a very important metric. Looking at the Apdex, they can measure the customer experience by seeing how many users are annoyed. It’s important to be able to track these things to have an impact, and have a way to roll back if you need to.
Achieving Operational Excellence by Leveraging AWS and New Relic in Your DevOps Journey — Mission Consulting
Mission Consulting works with customers to understand their business goals and objectives, as well as the applications they're running so that we can serve those business needs. We aim to have a strong understanding of your infrastructure and the processes of your environment so we can be of value as a DevOps consulting service provider.
In general, things tend to become more complex over the course of time when running workloads. As new features are released into the application or the product, new infrastructure's provisioned to support those feature sets. And as teams grow, the processes will continue to evolve over time.
DevOps is about understanding all that complexity and pairing you with our senior engineers and consultants who can really do that deep technical discovery and understand the application — how it's packaged, how it's built, how it's deployed, how to run it, and how to serve it at a large scale in production.
We use tools like New Relic to instrument and monitor the environment and help with all of the observability. We capture not only the metrics, but the right metrics. Because that's a very important aspect. Even a simple architecture could have hundreds of different data points to monitor and alert on, but not every one is necessarily relevant. It's really about determining the right things to monitor and alert on.
Along with the general architecture in the roadmapping, we perform hands on keyboard work. Our engineers are involved with activities like scripting, creating those automation components that help businesses achieve their goals, setting up the CI/CD pipelines and deployment processes, as well as doing all of the infrastructure's code activities like templating.
If you have any additional questions about Mission, our managed DevOps service, or about the New Relic product, or even from the AWS platform, please feel free to reach out.