In this post, we compare and contrast different container monitoring tools, and discuss two customer use cases leveraging them. But first, let’s consider the two commonly used Amazon orchestration tools to run containers on EC2 instances - Amazon Elastic Container Service (ECS) and Amazon Elastic Kubernetes Service (EKS). This will help us better evaluate the tools available to monitor them.
Amazon ECS
Launched in 2014, Amazon Elastic Container Service (ECS) is a highly scalable, high performance container orchestration service. It is very easy to get up and running, supports Docker containers, and allows you to easily run and scale containerized applications on AWS.
ECS benefits
- Very easy to use and adopt - for a long time, it has been one of the easiest ways to get containers running on Amazon, and taking advantage of their services
- Docker Compose support
- Supports “Serverless” clusters with AWS Fargate serverless compute engine.
- Secure by default
- Performs very well at scale
- AWS Service integration (i.e., IAM, Parameter Store)
- Optimized for cost
- Can scale containers and notes using ECS fairly easily
ECS limitations
Some of the limitations of ECS are:
- In-place updates to your running containers are tricky
- Limited to the Docker model. So other container runtimes aren't really supported
- It's an AWS specific tool, so it is not cloud-agnostic
- If you’ve built an ecosystem around ECS, it’s not easy to transfer to another cloud or potentially run in a sort of multi-cloud situation.
- Limited ecosystem since it doesn't have the kind of open-source community that Kubernetes has
Amazon EKS
Amazon Elastic Kubernetes Service (EKS) is a newer offering from Amazon. It was first made available in 2018. It is a managed Kubernetes service that makes it easy for you to run Kubernetes on AWS without needing to install, operate, and maintain your own Kubernetes control plane.
EKS benefits
- There is no control plane to manage. So that's a big advantage of EKS over ECS where, for example, you might have to run and manage your own Kubernetes cluster in a data center
- Secure by default
- Extensive open ecosystem that you can take advantage of
- Vastly extensible
- Built with the community, but still fully conforming and compatible to Kubernetes standards
- It offers another way to optimize the cost in terms of scaling up and down, running containers in a cloud environment, and taking advantage of all the things that a cloud gives you
- New capabilities with AWS Fargate serverless compute engine.
EKS limitations
- Requires Kubernetes experience. It's probably a little more of a learning curve to get up and running versus ECS
- Service integration with AWS is still pretty new, and some things aren't fully supported, well supported, or well documented such as only beta support for Network Load Balancers (NLB), ALB support only via ingress controller and Admission Controllers managed by AWS
How to monitor these containers
In terms of monitoring, let’s consider two options: Amazon CloudWatch, which is the native AWS tool, and Prometheus Grafana, an open-source community standard built around Kubernetes.
CloudWatch Container Insights
Launched in 2009, CloudWatch is a monitoring and observability service from Amazon. It enables you to collect metrics, set alarms, and automate actions based on those alarms. Alarms can be triggered by predefined thresholds or by using machine learning algorithms like anomaly detection, which examine activity over a period of time and adaptively react to anomalies that are detected.
In 2019, CloudWatch Container Insights was released. This provides high cardinality, granular monitoring, and metrics for either EKS or ECS. Within EKS, we get cluster node, pods, and namespace level metrics. It's incredibly easy to configure and consume.
Key Features and Benefits of Container Insights
One of the major advantages of Container Insights is that it allows for integration with traditional CloudWatch workflows, be they escalation and alerting chains or perhaps even kicking off other pieces of automation. You can monitor both ECS and EKS containers, leveraging similar alarms and dashboard configurations.
Container Insights is also very easy to deploy. With AWS Quickstart, you can deploy using a single command where you replace with your cluster name and region. It will deploy a new namespace as well as CloudWatch Agent DaemonSet, a bundled FluentD DaemonSet (logging to CloudWatch) and an optional StatsD integration that can be toggled on or off.
By the same token, if you already have fluency in production, which most people who are running Kubernetes clusters already do, and you just want it to continue to leverage the existing log flow collection that you have, you could just choose to deploy the CloudWatch agent daemon set with their provider.
Either way, the deployment is very easy to do and highly configurable.
Other key benefits include:
- High cardinality data collection, pre-built visualizations, and dashboards. You can dive deeper into them using CloudWatch Container Insights, and create your own custom dashboards based off of those insight queries.
- Leverages standard CloudWatch alarms and notifications
- Single pane of glass for application, performance, host, control plane, data plane insights
- Node scaling based on CW without Cluster AutoScaler - i.e., node_cpu_reserved_capacity/node_memory_reserved_capacity
- Standard HPA scaling based on Kubernetes metrics
Caveats
- Container Insights was only launched in 2019, so there are still a few regions that are unsupported in the typical AWS fashion
- While it is supported on ECS, it does not currently support batch jobs
- Currently no supported integration with external metrics. However, the k8s-cloudwatch-adapter can be used to scale HPAs from external CW metrics
Below are a few screenshots of the type of visualizations that Container Insights provides out-of-the-box.
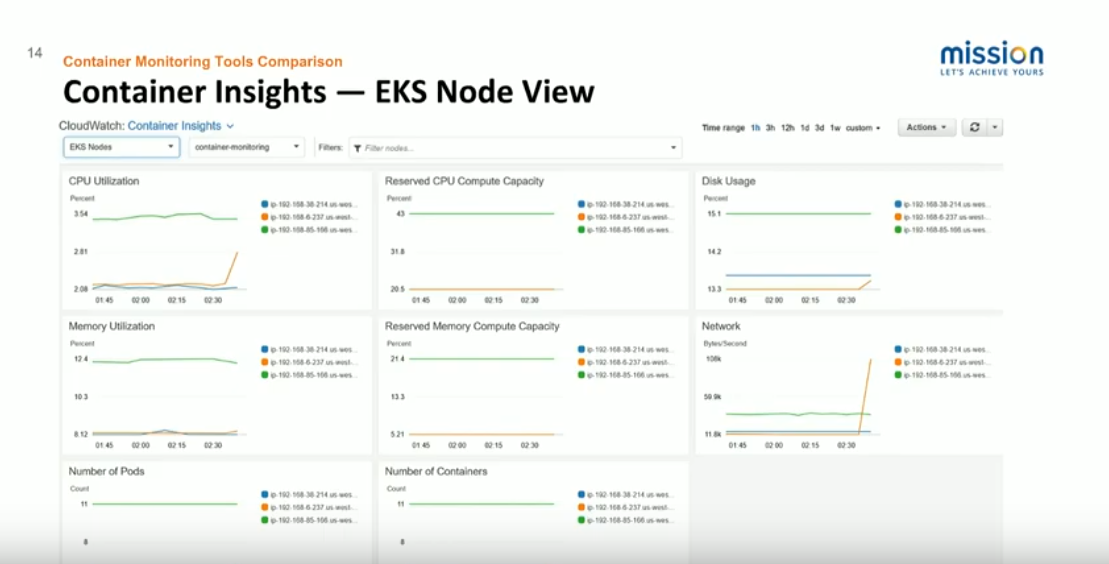
This screenshot is the node view. We can see CPU utilization, memory utilization, and the current reservations. The two columns in the middle are what would typically be used for cluster auto-scaling, standard disk and network, number of pods, and number of containers within those pods.
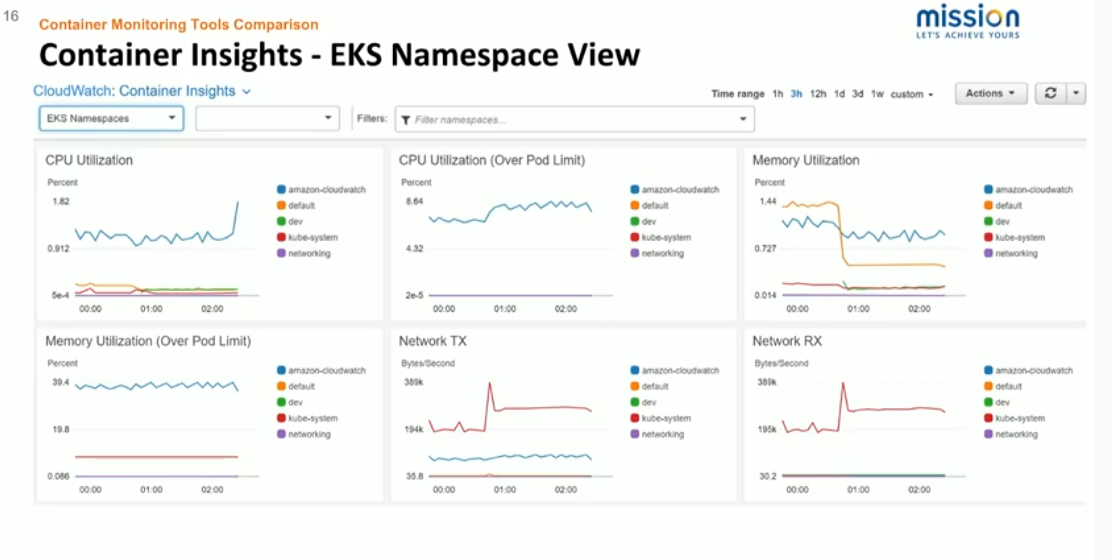
We can get out-of-the-box pod dashboards by mousing over any of the pod names or any of these graphs. In any of these dashboards, we're able to isolate a particular namespace, worker node, or deployment, and view those metrics in much greater granularity. We're also able to look at the overall namespace performance. This is really handy if you are running multiple environments or within the same cluster in any sort of multi-tenant fashion.
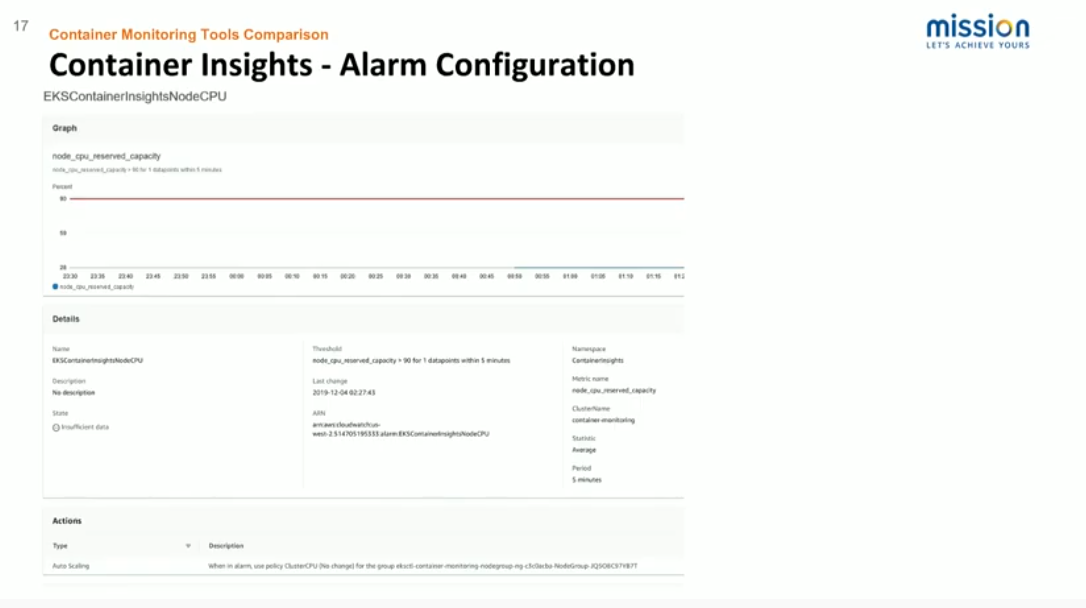
This screenshot illustrates how one might go about auto-scaling worker nodes based on a CloudWatch alarm. So with the provided node CPU reserve capacity, we’re saying that when we are hitting a threshold where we no longer have enough reserve capacity, we can define that relatively high in order to not unnecessarily scale the cluster. But whenever we do hit that limit, we can use the standard CloudWatch scaling action and choose the worker group autos ASG and a predefined scale up or scale down the threshold to efficiently and easily scale the cluster.
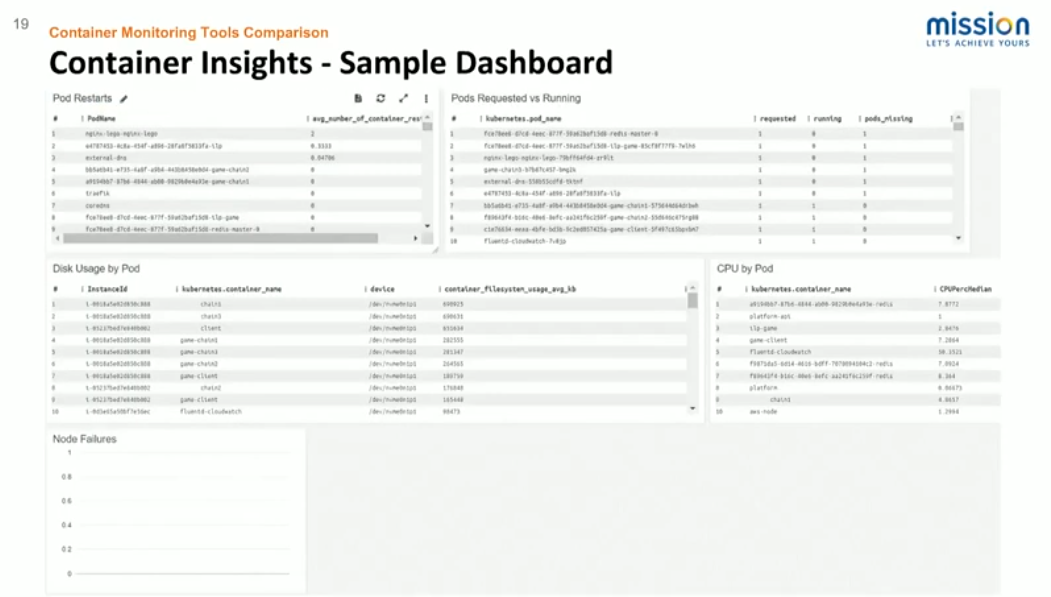
This screenshot is just a sample dashboard of some of the out-of-the-box queries that AWS provides. It’s very easy to build custom dashboards that can show the number of times a container pod has restarted. If you have anything that has been requested and unscheduled, any node failures, and so on.
The larger advantage here is the ability to integrate with existing alerting and escalation flows. So if you have some mission-critical deployments, and you want to be alerted every time, the pod restart count goes over a particular threshold; it's very easy to configure within the standard CloudWatch graphical user interface (GUI).
Prometheus
Prometheus is a free, open-source community software solution for event monitoring and alerting. It has pretty much become the standard for Kubernetes in terms of open source. And it is basically a time-series database that records real-time metrics. It's all built on primarily the HTTP pull model, which means that some type of metric gathering tool is deployed to wherever those metrics need to be gathered, and then that's exposed as an HTTP endpoint that you can configure Prometheus to go and gather those metrics on some interval.
Think of Prometheus like an electric meter reader at your home. Just as an electric meter reader shows how much electricity you used at your home, Prometheus gathers metrics and displays them graphically via Grafana. Grafana can also display alerts.
Metrics exporters are what expose metrics to Prometheus. The standard metric exporters that you always want to deploy are:
- cAdvisor gathers your container metrics
- Node Exporter gathers your node metrics
- Application metrics can also be exposed via pod sidecar
Prometheus is very extensible because it's open-source. So if there's some other application metric that you care about for deploying your application, you can absolutely measure that and expose it as an HTTP endpoint to Prometheus, and then configure Prometheus to go and gather that metric.
And it can really be absolutely any metric you choose. The standard way to do that is to expose it as a sidecar container in your pod. For reference, a pod sidecar is a pod container that you deploy alongside your other pod containers to assist them in some way. In this case, it would be for streaming logs and metrics.
You can set up a custom meter and tell Prometheus to measure a specific piece of data you are looking for. A pod sidecar will keep track of your application and measure it, and Prometheus will source this for metrics.
So, for example, if you had a web application that you wanted to measure HTTP 400s or such from your web server, you would count those and expose that metric as a sidecar kind of service. And then configure Prometheus to go and find that service on the interval, and pull that data in.
Deploying Prometheus
Helm is the standard way to deploy Prometheus in Kubernetes. It is pretty easy to configure basic metrics in alerting with Prometheus, and there are a lot of community resources regarding how to do that.
But this can be good and bad; there are a lot of knobs and dials that you can tune with Prometheus to gather custom metrics or gather metrics a different way or determine the interval that you want to gather them on and that sort of thing.
While pull is the standard way for gathering metrics in Prometheus, there is a metrics push gateway too, if that's the only way it can be done for any specific metric that you want.
Since Prometheus is open-source and extensible, alerting can happen through all sorts of different integrations such as email, Slack, HipChat, or whatever chat tool your organization uses. Prometheus is built around Kubernetes. Consequently, most of the community resources and the open-source integrations are built with the idea that you're deploying everything on Kubernetes.
Prometheus could be deployed and used in ECS as well. However you would need to deploy the standard metrics exporters, such as cAdvisor and Node Exporter, on your own into the cluster. However, with Helm Chart with Prometheus, that will get deployed for you pretty easily.
Another important difference between Prometheus and Container Insights is that scaling pods/nodes is not generally done with the Prometheus metrics. For pods, it's the horizontal pod or the auto-scaler in Kubernetes, and for nodes, it’s the cluster auto-scaler. You could potentially scale nodes in your EKS cluster based on CloudWatch metrics of some other AWS service. But with Prometheus and Grafana, that's not an easy use case.
You absolutely can configure Prometheus to gather metrics from multiple Kubernetes clusters. That definitely could be useful in terms of measuring metrics and comparing. For example, you may deploy multiple environments to separate clusters, but because Prometheus needs to pull from HTTP endpoints, that means those HTTP endpoints need to be exposed to Prometheus in some way.
Grafana
Grafana is essentially the standard tool for displaying Prometheus data. It can display data from a lot of different sources.

This screenshot gives a picture of container and pod memory usage. You can see that we have deployed some pods that kind of go up and down to give you an idea of how that data gets displayed.
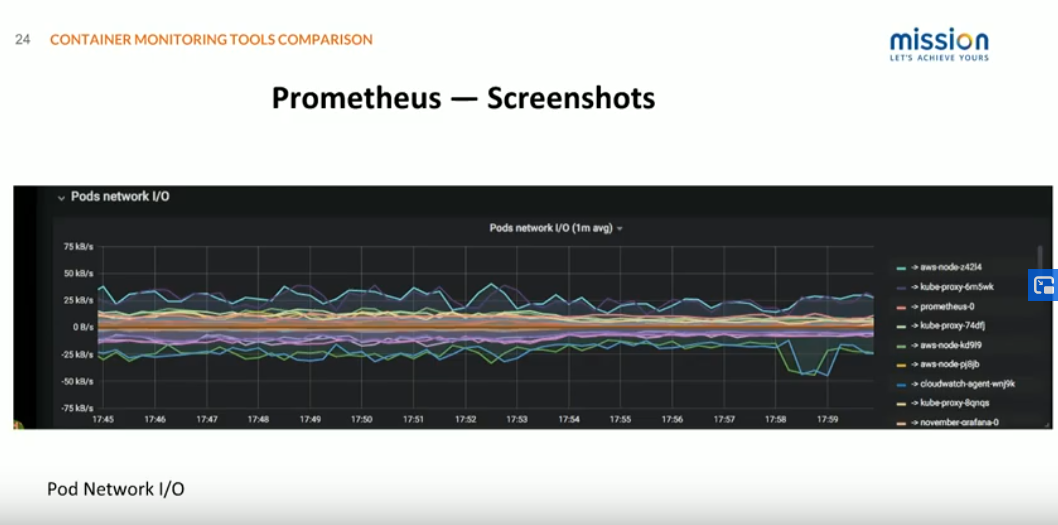
Here's Pod Network IO, and it's important to point out one big advantage of Prometheus and Grafana that we've talked about a couple of times is all the community resources that are available. This dashboard is built with very little configuration off of just a community available dashboard that kind of pulls in those standard Kubernetes data.
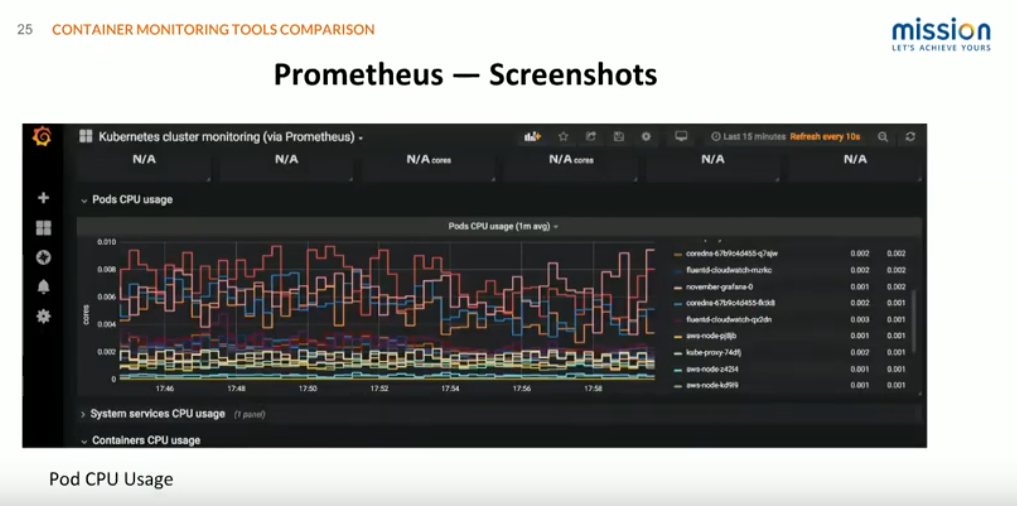
The third one here is just pod CPU usage. You can see here which pods are doing that. For example, if you're scaling pods with the horizontal pod auto scaler, based on CPU, you would want to know what are my pods doing, what is the pattern of CPUs you should look like, etc. like that.
Customer Use Case Example #1
The first customer reference is Your Call Football. Your Call Football offers football fans the opportunity to actually call plays in real-time. End-users are given choices of three different plays. The entire audience votes on whichever play they want the team to run. Those votes are then tallied and sent to the coaches. They call that play and are executed on the field by real players. There's also a simultaneous streaming component where you can watch the game through the application, vote through the application, and even win cash prizes based on how accurate your play calling is.
An application like this poses significant infrastructure challenges. The app has to handle both sharp, spikey bursts of traffic but also needs to scale to a pretty large scale during the game, and deliver consistent results. All of the voting tallies need to be compiled and delivered to the coaches. We have a ten-millisecond window to accomplish that to ensure that the games run in a timely fashion.
To ensure that Your Call Football could deliver on the application, we implemented Kubernetes via EKS, automated with standard TI tooling, scaling, and deployments through Helm.
From monitoring and a learning perspective, in the past, we have leveraged Prometheus and Grafana with alert manager to make sure that we get prompt notification of any trends or issues and provide real-time insights. But currently, as Container Insights has just been released this past year, we are running it in parallel as a Proof-of-Concept, because it does meet many of our core requirements and also prevents an easy way to view the container logs that they're already familiar with as they are familiar with CloudWatch.
How Mission can help
Mission can work with you to help choose and implement the right monitoring solution for your specific needs. Reach out to us if you have any questions about containers or monitoring, or if you need any assistance with your cloud journey.
FAQ
- How do AWS container monitoring tools integrate with third-party DevOps and monitoring solutions outside the AWS ecosystem?
AWS container monitoring tools are engineered for compatibility, allowing seamless integration with various third-party DevOps, monitoring, and management solutions. This integration capability ensures that AWS environments can be monitored and managed in conjunction with tools outside the AWS ecosystem, providing a holistic view of application performance and infrastructure health across diverse IT landscapes.
- What are the scalability limits of these monitoring tools, and how do they perform under extreme workloads?
The scalability of AWS container monitoring tools is a cornerstone of their design, enabling them to efficiently handle varying workloads, from small-scale applications to enterprise-level deployments. Leveraged on AWS's robust infrastructure, these tools can dynamically scale to meet the demands of high-volume, high-velocity data generated by large numbers of containers, ensuring comprehensive monitoring without compromising performance.
- Can these tools provide predictive analytics for container performance and resource utilization to proactively manage scalability and cost?
- AWS container monitoring tools offer advanced monitoring capabilities that can be complemented with AWS's analytics and machine learning services to predict future trends in container performance and resource utilization. These tools can forecast potential issues by analyzing historical data, allowing for preemptive resource optimization and cost management strategies. This predictive approach helps organizations maintain high levels of efficiency and performance, ensuring that resources are appropriately allocated to meet future demands.